Laurel-Cook.com


Designed and built by Laurel Aynne Cook
© Laurel Aynne Cook 2024

ANDREW F. HAYES, Ph.D.
When I think of data analysis, I think of Andrew Hayes- Professor of Psychology at the University of Calgary. His
methodology research is ubiquitous. Importantly, he has a heart for sharing his knowledge with others. He regularly offers
talks and workshops. I’ve been fortunate to participate in his 5-day course on moderation, mediation, and conditional
process analysis. This course is offered by Statistical Horizons. I strongly recommend taking his workshop if your institution
can send you (or you can personally afford a fee of around $1,595). Additionally, Hayes offers a multitude of free resources
for academics. I imagine that his most used resources include his macros for SPSS and SAS. The PROCESS macro is an
observed variable OLS regression path analysis modeling tool where V3 is the most recent version. If you intend to use this
macro, consider buying the 3rd edition of Introduction to Mediation, Moderation, and Conditional Process Analysis (eText =
$56 on Amazon).
AFHAYES.COM
ANOVA POWER ANALYSIS
Power ANalysis for GEneral Anova designs (i.e., PANGEA) is the first power analysis program for general ANOVA designs
(e.g., Winer, Brown, & Michels, 1991). PANGEA can handle designs with any number of factors, each with any number of
levels; any factor can be treated as fixed or random; and any valid pattern of nesting or crossing of the factors is allowed.
See the drop-down menu below for specific examples of designs covered by PANGEA. Working paper here.
JAKEWESTFALL.SHINYAPPS.IO/PANGEA
CONSORTIUM FOR THE ADVANCEMENT OF RESEARCH METHODS & ANALYSIS (CARMA)
The Nebraska College of Business offers a number of short courses related to research methods and analyses. CARMA
Short Courses place an emphasis on hands-on experience and on the application of the methodology aimed at skills
development. CARMA also provides research methods (RM) and statistics webcasts throughout the year. Through your
institution, you may have access to archived webcasts. These now number more than 100 and cover a range of
methodological and statistical issues. Live webcasts are typically added to the archived library within a week. The list of
archived videos is here. To access the archived webcast library, you will need to sign up as an individual user (usually with
your institutional email account).
BUSINESS.UNL.EDU/CARMA
DATA SCIENCE CHEAT-SHEET (MAVERICK LIN, Cornell University)
Updated in August of 2018, this 10-page “cheat-sheet” offers a useful guide about a variety of stats-related concepts.
Examples include an overview of probability, descriptive stats, data cleaning, modeling (overview, philosophies, taxonomy,
and metrics), regression, clustering, machine/deep learning, big data, SQL, & Python. Available as a PDF download and
promoted by Isaac Faber, Ph.D. Candidate at Stanford & Chief Data Scientist.
LINKEDIN.COM/FABERPOST
DATA VISUALIZATION (Financial Times)
In March (‘21), the Financial Times provided schools and researchers a free “visual vocabulary guide” (in PDF format) for
portraying data (e.g., deviation, correlation, ranking, distribution, change over time, magnitude, part-to-whole, spatial, and
flow). The file is available to download on GitHub.
FT.COM/CONTENT/VISUALGUIDE
EFFECT SIZES (DANIEL LAKEN, Ph.D.)
A few years ago, I came across a primer on the calculation and reporting of effect sizes for t-tests and F-tests. This resource
is published at Frontiers in Cognition and is Open Access. His easy-to-use spreadsheet is available to download below.
Lakens, Daniël (2013), “Calculating and reporting effect sizes to facilitate cumulative science: a practical primer for t-tests
and ANOVAs,” Frontiers in Psychology, 4, 863.
SITES.GOOGLE.COM/LAKEN
JOHNSON-NEYMAN TECHNIQUE
A free Microsoft Excel 2013 workbook is available to probe interactions by using the Johnson-Neyman approach. The
workbook includes the following tabs: (1) read me, (2) enter raw data, (3) HC3, (4) error check, (5) Johnson-Neyman figure
(perfect for publications!), and (6) simple slopes plot.
Carden, Stephen W., Nicholas S. Holtzman, and Michael J. Strube (2017), “CAHOST: an excel workbook for facilitating the
johnson-neyman technique for two-way interactions in multiple regression,” Frontiers in Psychology, 8, 1293.
NCBI.NLM.NIH.GOV
PROCESS 3.0 CUSTOM MODEL BUILDER
Darius-Aurel Frank, a PhD Fellow at Aarhus University (Denmark), has created a wonderful (and FREE!) tool that allows
researchers to use Andrew F. Hayes' latest SPSS PROCESS 3.0 macro with customizable models (i.e., for mediation,
moderation and conditional process analyses). The syntax for a customized model is automatically generated, and can be
pasted and easily run in SPSS. This resource requires an installed version of Excel.
DARIUSFRANK.COM
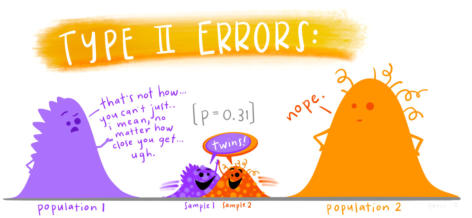
STATS ILLUSTRATIONS
Allison Horst, a data scientist at UC Santa Barbarba, has wonderful illustrations for those who teach stats. All of her high-
resolution artwork is fully available and encouraged for open use by the Creative Commons license.
Artwork by @Allison_Horst
GITHUB.COM/ALLISONHORST/STATS-ILLUSTRATIONS
STRUCTURAL EQUATION MODELING (S.E.M.)
I prefer to use AMOS for most of my structural equation models. However, I also have experience with SmartPLS. Please
feel free to contact me if you have questions about either program. Meanwhile, I’ve included some brief guides (with AMOS
screenshots) to use as a resource.
SEM BASICS
MAHALANOBIS DISTANCE
HANDBOOK OF THEORIES
There are several published handbooks of theories- most notably in social psychology. However, I also wanted to reference
a comprehensive list of the theories we use in marketing. As a result, I began asking my marketing students to research
theories of interest to them. They were encouraged to explore the top marketing journals and other related fields (e.g.,
business, cognition, sociology). So far, 150 theories have been collected and summarized. Many include figures and recent
examples. Each semester, I update my “handbook” and remove duplications. This collection is raw (unedited), but free to
use. As I read new articles and discover new theories, I’ll make updates. Feel free to contribute as you discover new ways to
explain behavioral phenomena. Simply e-mail me with the citation and a brief description, and I’ll be happy to include it!


Statistics


Theories


Explore some of the things I’ve found helpful in my career as a researcher


ANDREW F. HAYES, Ph.D.
Hayes offers a multitude of free resources
for academics. I imagine that his most
used resources include his macros for
SPSS and SAS. The PROCESS macro is an
observed variable OLS regression path
analysis modeling tool where V3 is the
most recent version. If you intend to use
this macro, consider buying the 2nd
edition of Introduction to Mediation,
Moderation, and Conditional Process
Analysis (eText = on Amazon).
AFHAYES.COM
ANOVA POWER ANALYSIS
Power ANalysis for GEneral Anova designs
(i.e., PANGEA) is the first power analysis
program for general ANOVA designs (e.g.,
Winer, Brown, & Michels, 1991). PANGEA
can handle designs with any number of
factors, each with any number of levels;
any factor can be treated as fixed or
random; and any valid pattern of nesting
or crossing of the factors is allowed.
JAKEWESTFALL.SHINYAPPS.IO/PANGEA
CONSORTIUM FOR THE
ADVANCEMENT OF RESEARCH
METHODS & ANALYSIS (CARMA)
CARMA Short Courses place an emphasis
on hands-on experience and on the
application of the methodology aimed at
skills development. CARMA also provides
research methods (RM) and statistics
webcasts throughout the year. Through
your institution, you may have access to
archived webcasts. These now number
more than 100 and cover a range of
methodological and statistical issues.
BUSINESS.UNL.EDU/CARMA
DATA SCIENCE CHEAT-SHEET
(MAVERICK LIN, Cornell University)
Updated in August of 2018, this 10-page
“cheat-sheet” offers a useful guide about a
variety of stats-related concepts. Examples
include an overview of probability,
descriptive stats, data cleaning, modeling
(overview, philosophies, taxonomy, and
metrics), regression, clustering,
machine/deep learning, big data, SQL, &
Python. Available as a PDF download and
promoted by Isaac Faber, Ph.D. Candidate
at Stanford & Chief Data Scientist.
LINKEDIN.COM/FABERPOST
EFFECT SIZES (DANIEL LAKEN, Ph.D.)
This resource is published at Frontiers in
Cognition and is Open Access.
SITES.GOOGLE.COM/LAKEN
JOHNSON-NEYMAN TECHNIQUE
A free Microsoft Excel 2013 workbook is
available to probe interactions by using
the Johnson-Neyman approach. The
workbook includes the following tabs: (1)
read me, (2) enter raw data, (3) HC3, (4)
error check, (5) Johnson-Neyman figure
(perfect for publications!), and (6) simple
slopes plot.
NCBI.NLM.NIH.GOV
PROCESS 3.0 CUSTOM MODEL
BUILDER
Darius-Aurel Frank, a PhD Fellow at Aarhus
University (Denmark), has created a
wonderful (and FREE!) tool that allows
researchers to use Andrew F. Hayes' latest
SPSS PROCESS 3.0 macro with
customizable models (i.e., for mediation,
moderation and conditional process
analyses). The syntax for a customized
model is automatically generated, and can
be pasted and easily run in SPSS.
DARIUSFRANK.COM
STRUCTURAL EQUATION MODELING
(S.E.M.)
I prefer to use AMOS for most of my
structural equation models. However, I
also have experience with SmartPLS.
Please feel free to contact me if you have
questions about either program.
Meanwhile, I’ve included some brief guides
(with AMOS screenshots) to use as a
resource.
SEM BASICS
MAHALANOBIS DISTANCE
